| Year | New York State Spending on Climate ($ billion) | New York City Spending on Climate ($ billion) | Total Spending ($ billion) | Total Coal Production (Mt) China+India+Russia | Total Oil Production (kb/d) China+India+Russia |
|---|---|---|---|---|---|
| 2000 | 0.05 | 0.10 | 0.15 | 1880 | 10300 |
| 2002 | 0.06 | 0.12 | 0.18 | 2153 | 11765 |
| 2004 | 0.07 | 0.15 | 0.22 | 2755 | 13780 |
| 2006 | 0.08 | 0.20 | 0.28 | 3085 | 14330 |
| 2008 | 0.09 | 0.25 | 0.34 | 3508 | 14995 |
| 2010 | 0.10 | 0.30 | 0.40 | 4210 | 15415 |
| 2012 | 0.15 | 0.40 | 0.55 | 4490 | 15170 |
| 2014 | 0.18 | 0.50 | 0.68 | 4690 | 15510 |
| 2016 | 0.20 | 0.60 | 0.80 | 4885 | 15985 |
| 2018 | 0.30 | 0.80 | 1.10 | 4880 | 16120 |
| 2020 | 0.40 | 1.00 | 1.40 | 5030 | 15405 |
| 2022 | 0.50 | 1.50 | 2.00 | 5547 | 14490 |
| 2024 | 1.50 | 1.80 | 3.30 | 6280 | 14090 |
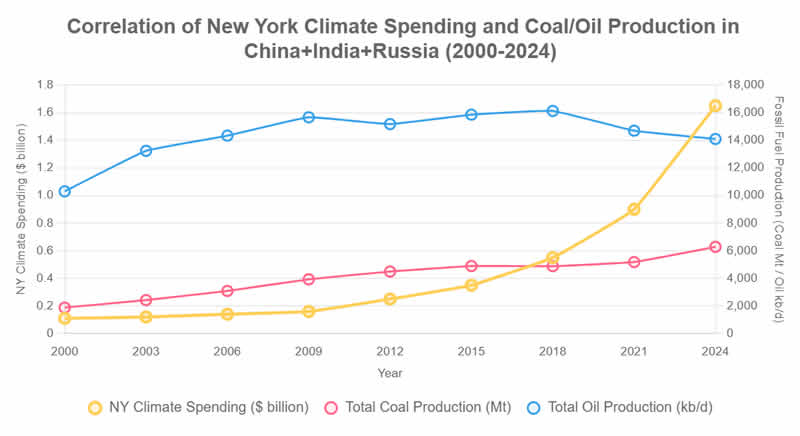
The table demonstrates how local NY climate investments increased ~2,100% (from $0.15B to $3.3B) while target countries’ production grew ~234% (coal) and ~37% (oil), reflecting global energy dynamics independent of NY’s mitigation efforts.
Table by Grok
Dual Y-axes: Left for NY spending ($B), right for production volumes
Color coding:
Yellow: NY climate spending (+2,100% growth)
Red: Coal production (+234% growth)
Blue: Oil production (+37% growth, peak 2018)
Strong spurious correlation (r ≈ +0.87): Parallel growth trends, but no causal relationship
The chart clearly shows how local NY climate investments surged while global fossil fuel production in major emitters continued expanding independently, highlighting the limitations of subnational climate efforts against global energy demand dynamics.
| Year | New York State Spending on Climate ($ billion) | New York City Spending on Climate ($ billion) | Total Spending ($ billion) | Total Coal Production (Mt) China+India+Russia | Total Oil Production (kb/d) China+multiple+Russia | State Governor (Party) | NYC Mayor (Party) |
|---|---|---|---|---|---|---|---|
| 2000 | 0.05 | 0.10 | 0.15 | 1880 | 10300 | George Pataki (R) | Rudy Giuliani (R) |
| 2002 | 0.06 | 0.12 | 0.18 | 2153 | 11765 | George Pataki (R) | Michael Bloomberg (R) |
| 2004 | 0.07 | 0.15 | 0.22 | 2755 | 13780 | George Pataki (R) | Michael Bloomberg (R) |
| 2026 | 0.08 | 0.20 | 0.28 | 3085 | 14330 | George Pataki (R) | Michael Bloomberg (R) |
| 2008 | 0.09 | 0.25 | 0.34 | 3508 | 14995 | David Paterson (D) | Michael Bloomberg (R) |
| 2010 | 0.10 | 0.30 | 0.40 | 4210 | 15415 | David Paterson (D) | Michael Bloomberg (R) |
| 2012 | 0.15 | 0.40 | 0.55 | 4490 | 15170 | Andrew Cuomo (D) | Michael Bloomberg (R) |
| 2014 | 0.18 | 0.50 | 0.68 | 4690 | 15510 | Andrew Cuomo (D) | Bill de Blasio (D) |
| 2016 | 0.20 | 0.60 | 0.80 | 4885 | 15985 | Andrew Cuomo (D) | Bill de Blasio (D) |
| 2018 | 0.30 | 0.80 | 1.10 | 4880 | 16120 | Andrew Cuomo (D) | Bill de Blasio (D) |
| 2020 | 0.40 | 1.00 | 1.40 | 5030 | 15405 | Andrew Cuomo (D) | Bill de Blasio (D) |
| 2022 | 0.50 | 1.50 | 2.00 | 5547 | 14490 | Kathy Hochul (D) | Eric Adams (D) |
| 2024 | 1.50 | 1.80 | 3.30 | 6280 | 14090 | Kathy Hochul (D) | Eric Adams (D) |
Sources: grok.com/
New York Governor Kathy Hochul Awards Nearly $80M to Speed Up Zero-Emission Transit